Different things come to mind if you think about what is essential for your business. Some would say the customers, but I would say that inventory is just as important. Without it, your customers will have no product with which to interact. For a business to grow and expand, inventory expansion is needed to guide your business to its goals.
Capterra’s blog post about inventory management statistics states that warehouses will expand inventory over the next 5 years by over 50%. That means that more and more businesses are expanding their inventory, which is why warehouses have to do so.
So, how do you exactly plan for inventory expansion? One way is by analyzing data and metrics for strategic B2B inventory expansion. In this article, I will explain what data and metrics you need, the analysis techniques you can use, and choosing the right metrics for your business. Also, I will show an example of how you can implement your data into an inventory expansion strategy to succeed.
12 KPIs To Keep Track Of B2B Inventory Expansion
KPIs or key performance indicators help identify how your business is performing. Here are some KPIs that will help you in analyzing data and metrics for strategic B2B inventory expansion:
- Cost Of Goods Sold
- Inventory Turnover Rate
- Days Sales Of Inventory
- Inventory Accuracy
- Inventory Shrinkage
- Gross Margin Return On Invested Inventory
- Stockout Rate
- Sell-Through Rate
- Backorder Rate
- Sales Velocity
- Optimal Reorder Point
- Economic Order Quantity
KPI#1 Cost Of Goods Sold
The first KPI I want to focus on is the cost of goods sold (COGS). It is the direct cost of producing goods, including materials and overhead costs. COGS is essential in calculating the profitability of your B2B business and getting an idea of whether inventory expansion is possible.
COGS = Beginning Inventory + Purchases – Ending Inventory
Analyzing COGS grants a deeper insight into your business’s whole production process. It can reveal where costs must be reduced to help improve profit margins and see where inventory can be optimized to improve day-to-day operations.
KPI#2 Inventory Turnover Rate
Let’s now look at the inventory turnover rate, a metric used to measure the efficiency of a company’s inventory management. It calculates how often a company’s inventory is sold and replaced within a specific period, typically a year or quarterly. Here is how it is calculated:
Inventory Turnover Rate = Cost of Goods Sold / Average Inventory Value
It helps you to understand how fast your inventory is moving. It helps to identify which products are doing well and which are doing poorly. A higher turnover rate would suggest efficient inventory management, but a lower turnover may indicate that inventory is slow-moving and inefficient.
KPI#3 Days Sales Of Inventory
COGS and turnover rates are great KPIs, but when you need a day-to-day analysis to find out more specific problems, then days sales of inventory (DSI) is what you need. It measures the average number of days it takes for inventory to be sold, calculated by:
Days Sales of Inventory = Average Inventory / (Cost of Goods Sold / 365 days)
When you need to assess the speed of your inventory movement, that is where DSI shines. It can identify areas where inventory is tied up for too long and suggest potential overstocking. With DSI data, you can figure out where to adjust inventory levels and free up capital for inventory expansion for faster-moving products to boost sales.
KPI#4 Inventory Accuracy
If there is one KPI to count on, it is knowing how much inventory you are holding. Inventory accuracy measures the inventory levels against the records kept against it. Now, think about finding the accuracy of hundreds of thousands of inventory. It can be challenging to determine the degree of accuracy, which is why inventory accuracy is calculated as a percentage by:
Inventory Accuracy = (Actual Inventory Count / Recorded Inventory Count) x 100%
When you want to make inventory expansion decisions, inventory accuracy helps you make informed decisions. The data you need to acquire must be as accurate as possible, which is where inventory accuracy helps. It exposes where your inventory is lagging and can be the first indicator of why your inventory expansion plan is not viable.
KPI#5 Inventory Shrinkage
Another important KPI to look out for is inventory shrinkage. Where accuracy looks at the overall inventory, shrinkage looks at why you have reduced inventory. It is calculated by:
Inventory Shrinkage = (Recorded Inventory – Actual Inventory) / Recorded Inventory x 100%
Many ways could cause inventory shrinkage. Theft is one of the highest causes of inventory shrinkage, where 57% of theft could be done by company insiders, according to Exploding Topics. Another way could be through damages to inventory, which can be caused by shipping. When you figure out a shrinkage in your inventory, you can start to identify why it is occurring.
KPI#6 Gross Margin Return On Invested Inventory
When you need to know if your inventory investments are paying off, then gross margin return on investment (GMROII) is what you need to know. GMROII tells you how your inventory turns into cash against how much you invest. It helps your business assess the profitability of inventory investments by calculating the following:
GMROII = (Gross Margin / Average Inventory) x 100%
This KPI provides insight into the gross margin earned to the average inventory investment. A higher GMROII indicates you have better profitability from inventory investments, which can then be used to understand where inventory expansion can be made for higher margins.
KPI#7 Stockout Rate
Stockouts are when you have low inventory levels against higher demands for the product you are selling. This means that you don’t have enough inventory to satisfy your customers. Therefore, understanding stockout rates measures the frequency or percentage when demand exceeds available inventory. It is calculated via the equation:
Stockout Rate = (Number of Stockouts / Total Number of Sales) x 100%
A higher percentage of stockouts means your inventory turnover will be much lower than you usually expect it to be over some time. When you have low stockout rates, your B2B business can expand inventory. Otherwise, you will run into more stockouts in the future because you have not dealt with the initial reasons why it was occurring and adding more reasons that it is occurring. That is why stockout rates help lay the groundwork for sustainable inventory expansion strategies.
KPI#8 Sell-Through Rate
Along with stockout rates, sell-through rates measure the inventory sold against the total inventory available. It tells you how much your business is efficiently selling inventory and is calculated by:
Sell-Through Rate = (Units Sold / Total Units Available) x 100%
Monitoring sell-through rates gives you more data to make better pricing adjustments, marketing decisions, and inventory optimization. Sell-through rates allow your business to make data-driven sales optimization decisions.
KPI#9 Backorder Rate
In B2B eCommerce, backorders are inevitable. If the 2020 pandemic has taught the world anything, it has to be that supply chain issues can cause a stockout for your business. To deal with shipping delays, backorder rates can help understand where your business can optimize inventory when you run into stockout issues. Backorder rates are calculated based on the following:
Backorder Rate = (Number of Backorders / Total Number of Orders) x 100%
The higher the backorder rate, the more you need to optimize your business’s inventory. It means that you cannot yet go into inventory expansion and that backorders will keep increasing. When you identify such a problem, demand forecasting and market trends can better align with your inventory expansion plans.
KPI#10 Sales Velocity
In B2B, speed is key. You have to deal with multiple suppliers and other businesses to ensure sales are as fast as possible. That is where sales velocity is how you can identify if there are any problems in that. It is calculated by:
Equation: Sales Velocity = Units Sold / Period
On its own, it will not do much good. However, when you use it with other KPIs, you can identify if you are doing well regarding sales speed. Moreover, monitoring sales velocity helps you to determine where you can improve the speed of sales with the help of the other KPIs. The faster you can sell your old inventory, the more you can add.
KPI#11 Optimal Reorder Point
A reorder point is when you must reorder new inventory at a certain level. The optimal reorder point considers factors in lead time, demand variability, and desired service level to ensure correct inventory. Here is how it is calculated:
Optimal Reorder Point = (Lead Time Demand x Lead Time) + Safety Stock
Knowing optimal reorder points gives your business the data to avoid stockouts or inventory overstocking. You can optimize your inventory by automating your reorder points to reduce errors and improve sales growth and customer satisfaction.
KPI#12 Economic Order Quantity
You might have heard of minimum order quantity or MOQ being discussed for B2B wholesale business. However, less talked about in B2B is the economic order quantity (EOQ). It is a metric that takes MOQ and calculates the minimum amount needed for optimal profit margins. It is calculated by:
EOQ = √((2 * Demand * Ordering Cost) / Holding Cost per Unit)
I cannot stress enough how undervalued EOQ is for your B2B business. It determines the most cost-effective order quantity to balance ordering costs and holding costs. By optimizing the EOQ of your business, you can identify opportunities for inventory expansion by minimizing total inventory costs and maximizing profitability. With all of that, managing your inventory is much easier and ensures your business is in the right position for inventory expansion.
5 Inventory Analysis Techniques To Use For B2B Inventory Expansion
With the KPIs, you need the right analysis techniques to pair up with. Here are the product categorizations for inventory analysis techniques to help with analyzing data and metrics for strategic B2B inventory expansion:
- ABC Analysis
- VED Analysis
- HML Analysis
- SDE Analysis
- FSN Analysis
Technique#1 ABC Analysis
ABC inventory analysis is one of the most common types of product categorization used for inventory expansion. It tiers the products into 3 different tiers. Tier A is your best-selling product that contributes the most to revenue, tier 2 is your next best product, and tier C is the least successful inventory on the list.
When you want to expand on your inventory, ABC analysis helps put your inventory into perspective. With it, you can identify which of your products generates the most revenue for your business. It gives you an understanding of where inventory expansion would be the most effective and where it would result in a loss of revenue. You can center marketing campaigns and put more effort into tier A while developing other ways to ensure that tier C is not becoming deadstock over time.
Technique#2 VED Analysis
VED categorizes your inventory a bit differently. It takes into account which inventory is Vital, Essential, and Desirable. Vital is irreplaceable for day-to-day operations, which means you need it for your business. Essential inventory is necessary, but substitutes can be sold instead. Desirable is like vanity inventory that looks good for your business but isn’t crucial.
A VED analysis of your inventory gives you a deeper understanding of it. Vital inventory is always needed, whether it is something that you are selling or using for production. On the other hand, essential inventory is always handy, but replacements are available, so you don’t have to worry about it. Desirable inventory is those items you sell that customers are not buying all the time and may peak at different times of the year. Knowing this analysis of your inventory can help you expand inventory when it is the right time while also maintaining vital inventory to keep the business running smoothly.
Technique#3 HML Analysis
Like ABC analysis, HML inventory analysis looks at the monetary value of inventory instead of the per unit cost of inventory in terms of High, Medium, and Low. This classification helps prioritize inventory management efforts and resources according to the value of items.
With HML, you know which high-value inventory items are in stock and manage the resources needed to maintain them. Similarly, low-value inventory items can be identified and evaluated to help improve or phase them out of your inventory. It tracks the overall inventory performance, which your B2B business can then use to optimize inventory to prepare them for expansion.
Technique#4 SDE Analysis
Now let’s take an inventory analysis that considers your inventory’s demand. SDE or Scrace, Difficult, and Easy. Scare inventory has unpredictable demand patterns that need careful attention for procurement. The complex is still managed but might have longer lead times. Accessible inventory refers to those always demanded and easily obtained by a business.
SDE analysis is more customer-focused, which is especially important for B2B businesses. This allows more calculated business decisions and more insight into ROI for customer segments with different demands. By expanding the inventory of items with stable and predictable demand, businesses can minimize the risk of stockouts and understocking.
Technique#5 FSN Analysis
I previously mentioned sales velocity and inventory turnover rate, which is where FSN analysis can be taken full advantage of. FSN refers to the study done on inventory movement and categorizes them as Fast, Slow, and Non-Moving. It helps to analyze which inventory is performing well in terms of how fast they are moving into the hands of the customers.
FSN analysis can give your business a greater insight into the growth potential of your inventory. Fast-moving inventory would indicate that you can expand inventory more efficiently, while non-moving inventory might be more challenging to move. FSN analysis emphasizes where your business can improve and market your inventory accordingly.
Choosing The Right Data And Metrics For Strategic B2B Inventory Expansion
Choosing the correct data and metrics for strategic B2B inventory expansion is essential. Some KPIs might look good on paper but do not raise awareness of where your inventory is lacking. So here are some things that you want to think about when choosing the KPIs and analysis techniques you need to implement:
- Avoiding wrong metrics: Some KPIs are considered to be vanity metrics. They look good but don’t tell the whole story. For example, sales figures are good, but they won’t tell you where you can expand your inventory for inventory that is not performing well.
- Focus on answering business questions: Always answer business questions when using these data and metrics for your business. Will this increase costs, will it be better for inventory management, what strategy will be the best; these are all questions that need to be answered to make informed business decisions.
- Customers are key to business growth: Your customers drive your business growth. So, always keep your customers in mind when implementing inventory expansion strategies.
- Monitor trends: Trends are key to where you can improve your business’s inventory. A new trend sells faster than outdated ones. Also, trends in inventory management could help unlock your business’s expansion strategies, so do market research to keep up with trends.
- Implementing them into practice: All these KPIs and techniques are great on paper, but implementing them into inventory expansion strategies matters. Getting the implementation right is where you can differentiate your business from the competition. So, make informed decisions when implementing strategies.
How A Variant Mix&Match Bundle App On Shopify Can Help Your B2B Inventory Expansion
Speaking of implementing strategies for inventory expansion, exactly how can you do that for your eCommerce business? On Shopify, you have access to third-party applications to help streamline the selling process on your product page.
One such app that can help with this is a bulk order app on Shopify. Below, I have highlighted an example of how a variant mix-and-match bundle app can help with inventory expansion strategies:
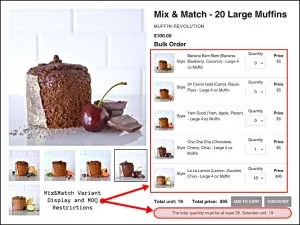
All the variants for this product are shown on one product page, where customers can choose the quantity of each variant via a dropdown menu. This allows customers of the store to select the amount they want for the bundle. The app also ensures customers choose 20 muffins when all the bundles are added.
So, what is the relationship between an app like this and inventory expansion strategies? Bundling products together like this in a mix-and-match style can help you better understand which one of your product variants is performing well. Then, you can make marketing strategies based on your best-selling products and expand your inventory. Or, separately, you can pair up slow-moving products with a fast-moving product and combine them in bundles like this to help sell the slow inventory and increase the average order value of orders.
All the while, a restriction is placed on the product to help customers order the correct amount. Customers could accidentally order more than 20 muffins, messing up your inventory management. However, this restriction allows customers to order the right amount and streamlines the customer experience for greater satisfaction.
With one app added to your Shopify store, there are endless possibilities for inventory expansion strategies that you can implement for your eCommerce store.
Bottom Line
Ultimately, your business needs to expand inventory to grow. That is where analyzing data and metrics for strategic B2B inventory expansion is how your business can achieve that. The right KPIs combined with the analysis technique can help you achieve the right inventory expansion strategies for your business.